Solutions
Agentic Platform
Operational Insights
Technology
Use Cases
Design Partners
About
Schedule a demo
Start With Intelligence, Then Automate What
Actually Matters
Unify and analyze years of ticketing data across Jira, ServiceNow, Zendesk, and Slack to reveal what’s really happening across your organization — before deploying a single agent.
Schedule a demo
Why Insights
First
You can’t optimize what you can’t measure.
Multiple disconnected systems
Manual reporting & guesswork about where time and cost go
Risk of automating the wrong processes
Start seeing ROI from day one — even before
automation.
Schedule a demo
visibility + resource allocation combined
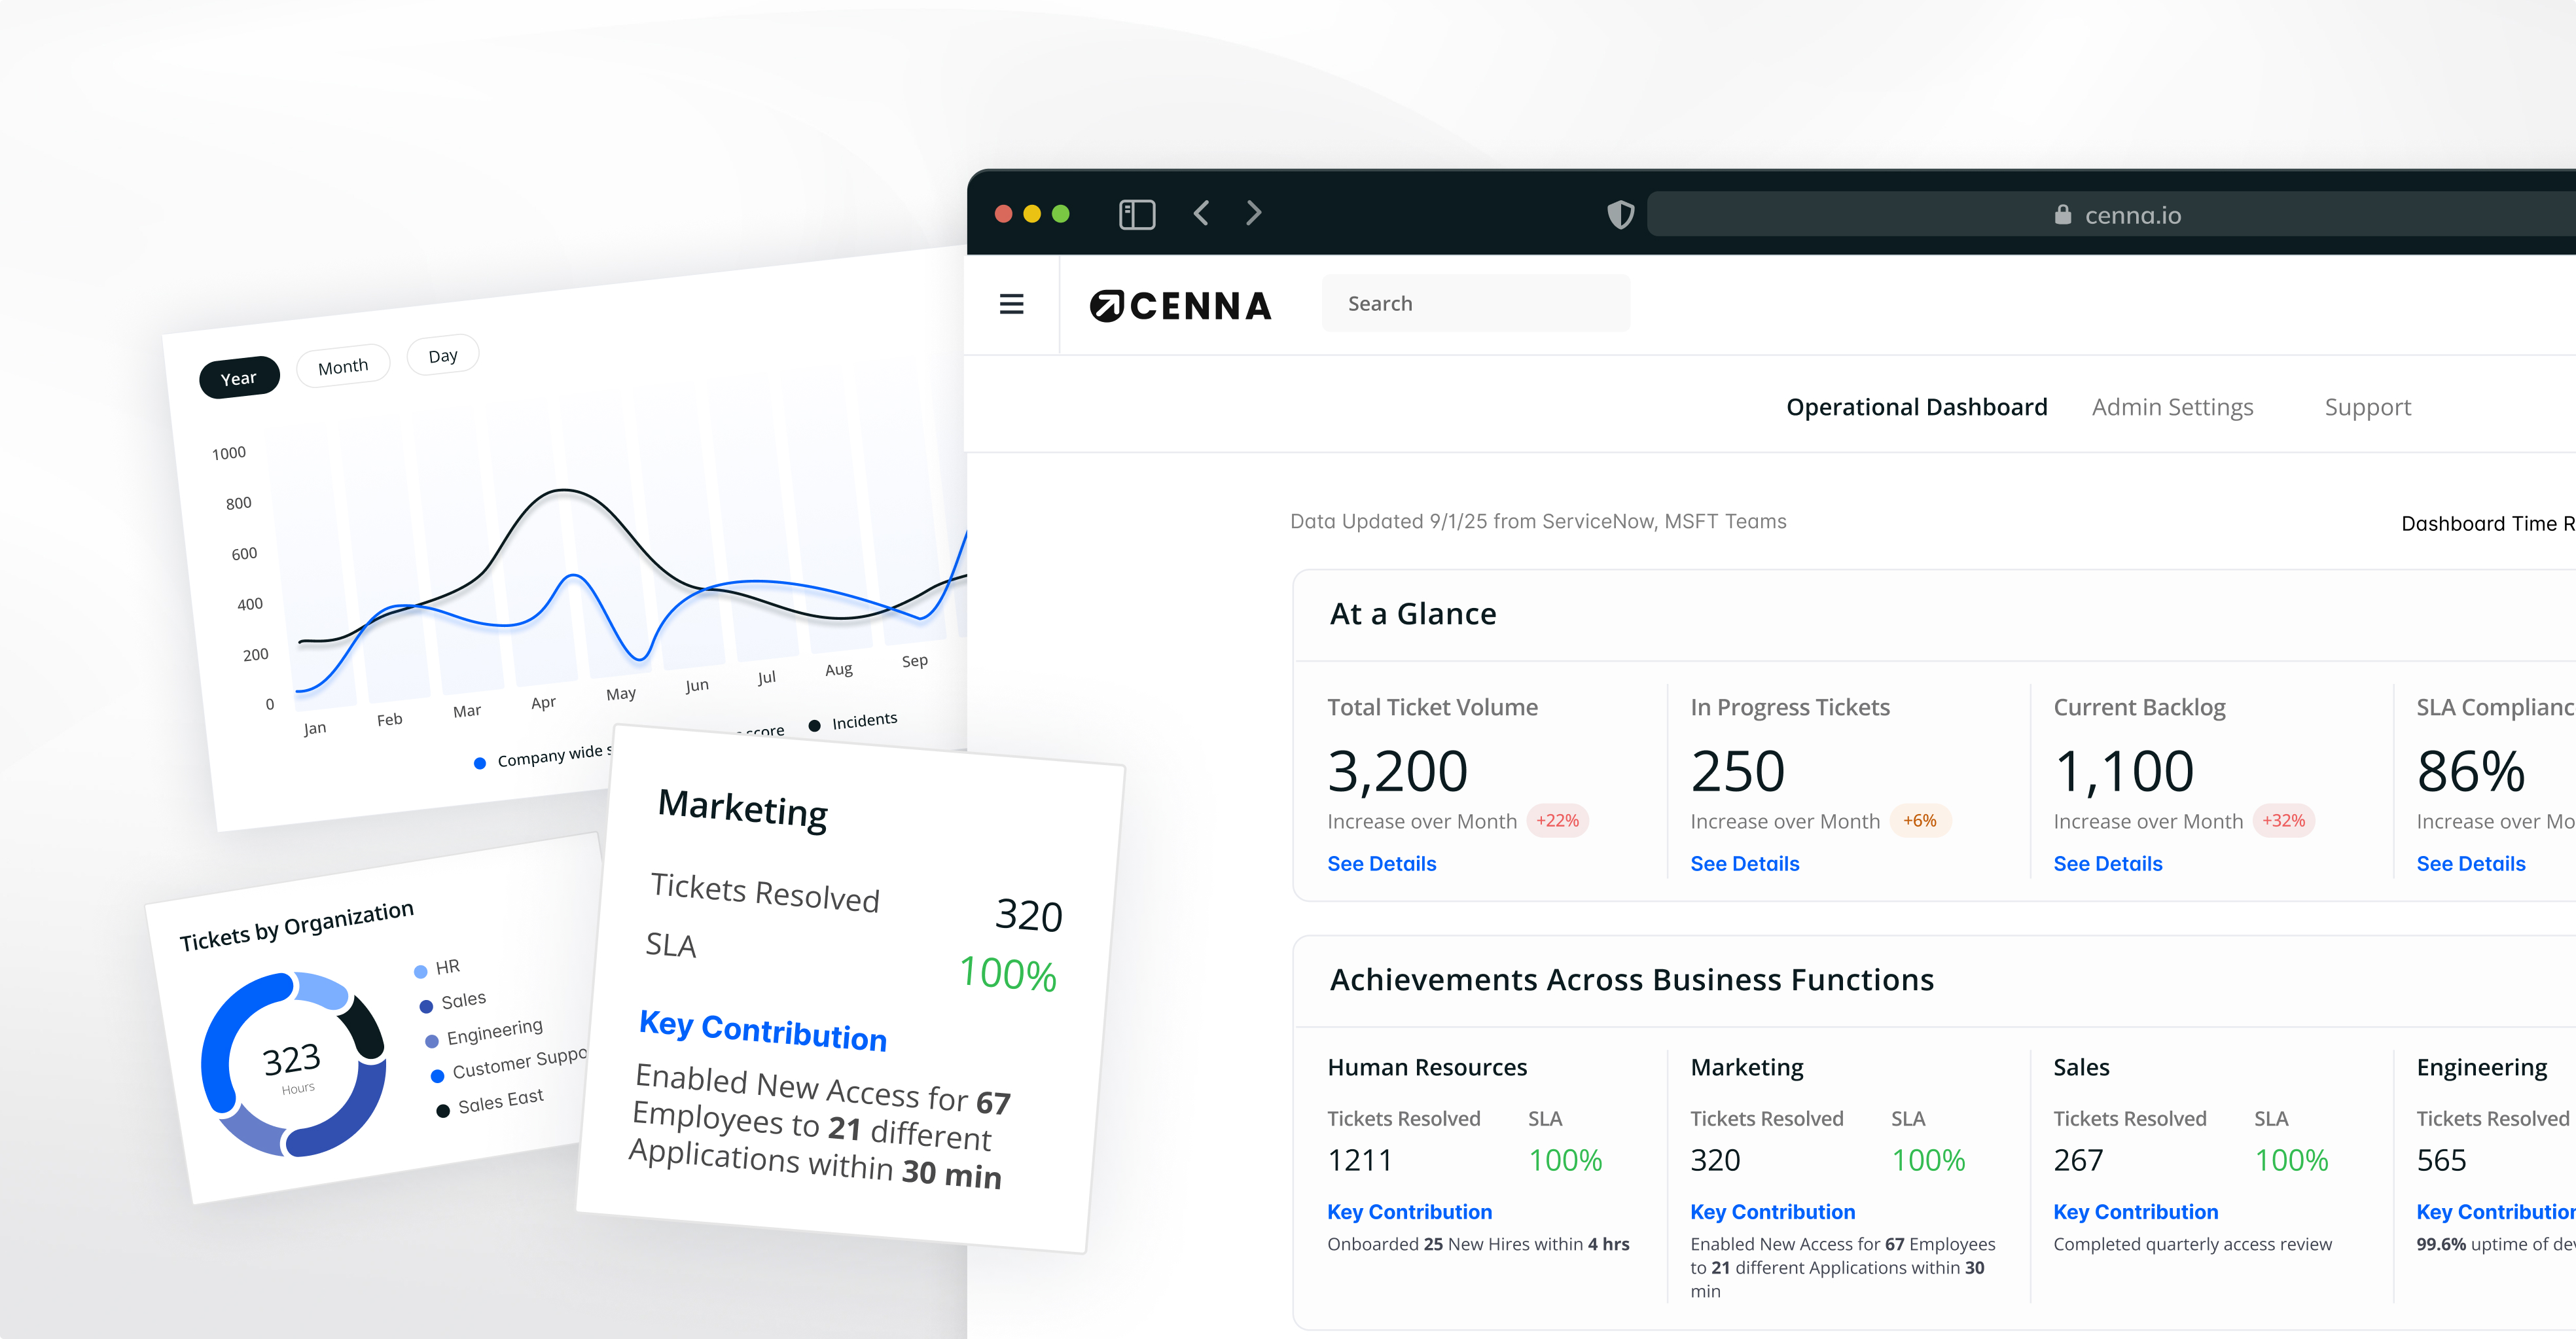
See Everything Clearly — Unified
Operational Visibility
One command center for SLA, MTTR, backlog trends, team workload.
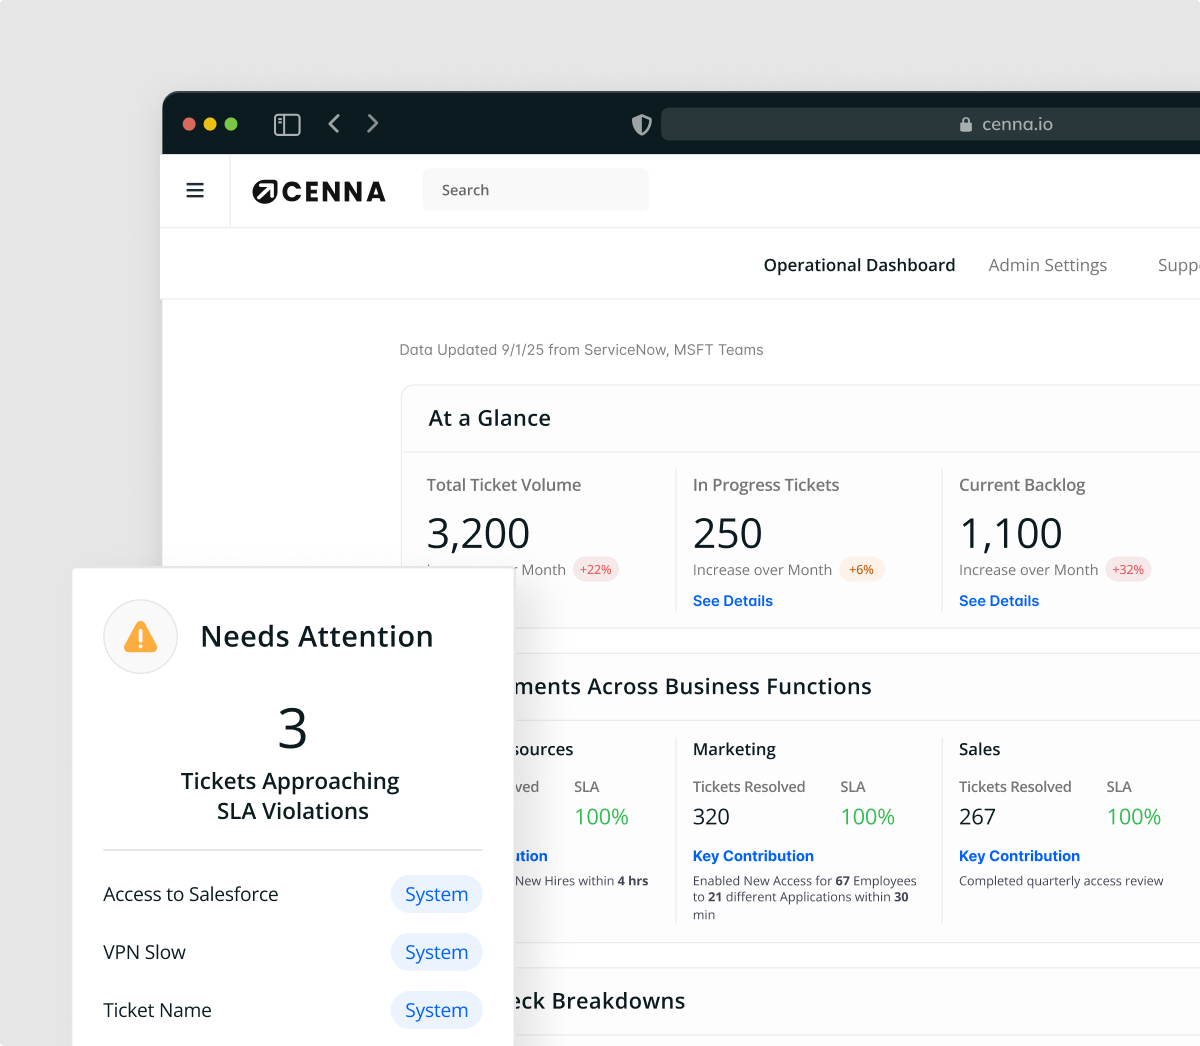
Real-time alerts & bottleneck detection.
Department & skill-based analytics to plan resources.
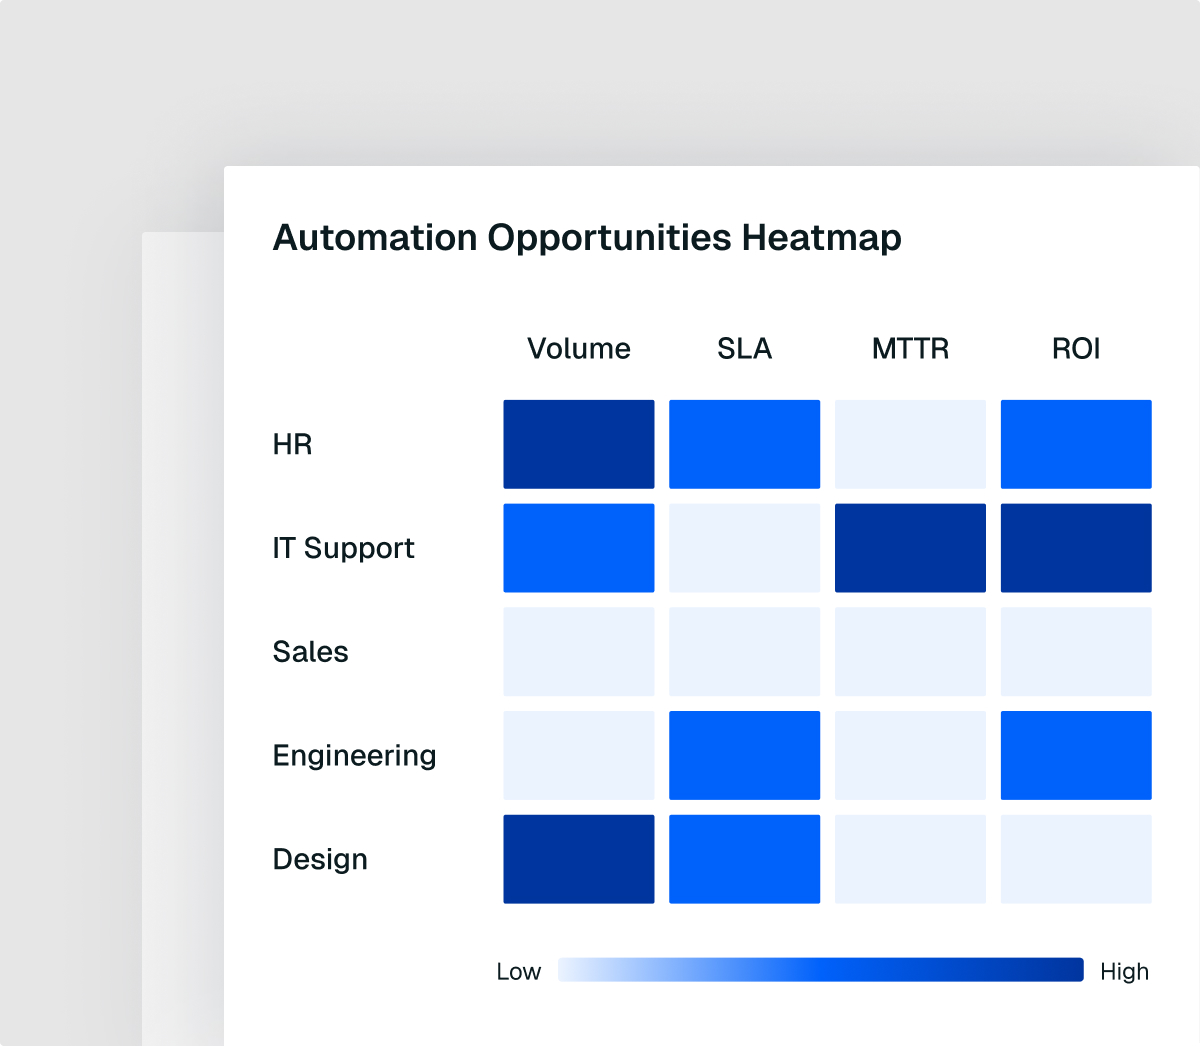
automation targeting + intelligent strategy combined
Know Where to
Automate
— Smart Targeting & Strategy
Analyze ticket patterns to find highest ROI opportunities.
Forecast automation impact before you build.
Agent recommendation engine + rollout roadmap.
knowledge mining + cost savings combined)
Unlock Knowledge &
Optimize
Processes
Turn resolved tickets into a searchable knowledge graph.
Spot inefficiencies & redundancies.
Show real cost savings stories (e.g., password reset automation, license rightsizing, vendor consolidation).
How It Works —
Low-Lift
, Fast Start
Phase 1
Connect & analyze data (PII-safe, 2–4 weeks)
Phase 2
Build insights & automation roadmap (1–2 weeks)
Phase 3
Deploy and scale high-ROI agents continuously
Your operations hold answers — unlock them with CENNA.
Schedule a demo
Boost Productivity with Cenna
Schedule a demo
Company
Use Cases
About
Support
Solutions
Agentic Platform
Operational Intelligence
Contact us
1 Ferry Building Suite #201
San Francisco, CA 94111
contact@cenna.io


.webp)


